Crop rotation is the easiest yield you can get. I call it "the gift that keeps on giving." Corn yield increases 10 to 19% when rotated with soybean, while soybean yield increases 14 to 23% when rotated with corn. For a summary of these rotation responses click here and here. This rotation effect is even more dramatic in stressful years.
The rotation effect lasts at most two years and depends upon the length of the break between similar crops. When you have two or more break years, then the yield of second-year corn is 7 to 8% greater than continuous corn. If there is only one break year, then the yield of second-year corn is the same as continuous corn.
Tillage used to be about controlling weeds and preparing a seedbed. Today it is all about stand establishment. We have many excellent herbicides and advanced technology on our planters. So tillage is often not necessary in today’s corn production systems, except in continuous corn. Tillage responses are more often measured in the northern corn belt and can increase yield 5 to 7%.
How does crop rotation and tillage interact to affect grain yield?
A corn-soybean rotation X tillage study was begun in 1983 at Arlington, WI. The rotation treatments consist of continuous corn, continuous soybean, alternating corn and soybean, and five years of corn followed by five years of soybean. Every phase of these 14 rotation treatments is grown every year. Two tillage treatments designated no-till (NT) and conventional-till (CT) have been practiced. since 1987. No-till consists of one-pass with a 13-wave coulter, followed by trash whippers and then double disc seed openers. Conventional-till is fall chisel plow followed by two spring field-cultivator operations. The continuous corn and soybean plots have been in place 30 years. The results for the previous 20 years (1993-2012) are shown in Figure 1 for corn and Figure 2 for soybean.
Little corn yield differences are observed in rotated corn (CS) and first-year (1C) corn following 5-years of soybean (Figure 1). During the second-year of corn plots that had conventional tillage increased yield 5% over no-till plots (2C). Yield was 10 to 11% greater for conventional-till plots than for no-till plots as the number of continuous corn production years increased (3C, 4C, and 5C). So, tillage is not needed when corn is annually rotated with soybean. Tillage can make up some of the rotation effect over time in continuous corn, but it does not bring yield back to rotated corn yield levels.
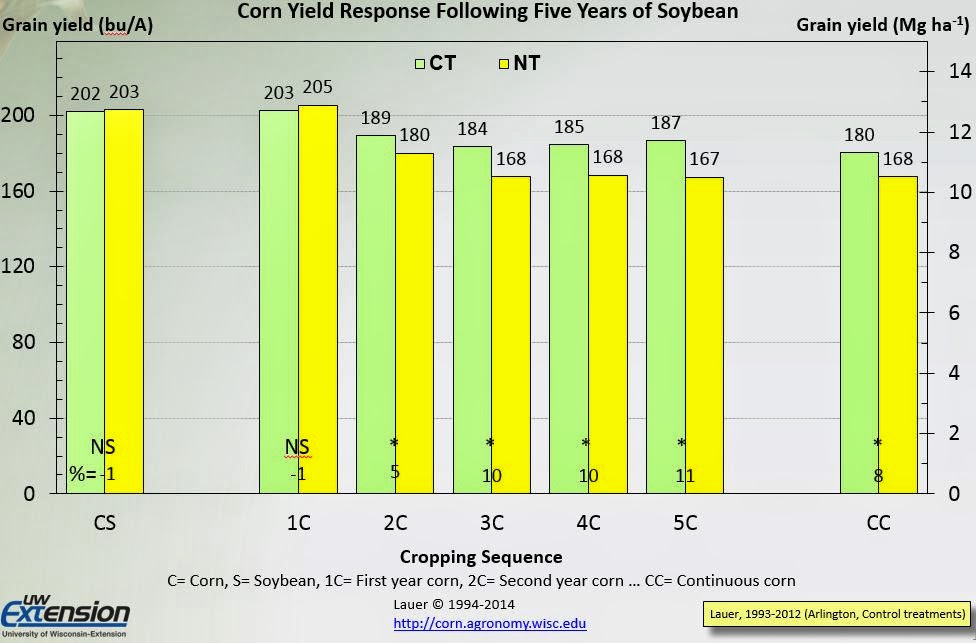 |
| Figure 1. Corn yield response to rotation and tillage following five years of soybean during 1993 to 2012 at Arlington, WI. Asterisks indicate statistical differences at P < 0.05. NS= non significant. Percentage values indicate relative differences between tillage systems for a phase in the rotation sequence. |
The story is somewhat different for soybean. Grain yield is 3 to 5% greater in no-till than conventional till for the rotated soybean (SC), first- (1S) and second-year (2S) soybean following five years of corn (Figure 2). There is no tillage effect as the number of years of continuous soybean production increases (3S, 4S and 5S) Conventional-till does increase yield over no-till in soybean plots that have been in continuous production for 30 years (SS). So, tillage is not needed when soybean is annually rotated with corn.
 |
| Figure 2. Soybean yield response to rotation and tillage following five years of corn during 1993 to 2012 at Arlington, WI. Asterisks indicate statistical differences at P < 0.05. NS= non significant. Percentage values indicate relative differences between tillage systems for a phase in the rotation sequence. |
