Tuesday, December 27, 2016

State Corn Yield Contest Winners

The winners of the 2016 National Corn Growers Association corn yield contest were announced recently. The highest yield recorded in Wisconsin during 2016 was by Luke Mezera of Bagley who grew Dekalb DKC62-78 which yielded 312.2 bu/A. Winners of the four contests that Wisconsin corn growers are eligible for are shown in Table 1.


Table 1. Winners of the 2016 National Corn Growers Association corn yield contest.
Contest Name City Brand Hybrid Yield (bu/A)
AA Non-Irrigated Jeff Mezera Bagley Dekalb DKC60-69 288.7
AA No-Till/Strip-Till Non-Irrigated Luke Mezera Bagley Dekalb DKC62-78 312.2
No-Till/Strip-Till Irrigated Mark Bacon Hancock Dekalb DKC 53-56RIB 277.2
Irrigated Jeff Laskowski Plover Pioneer P0533AM1 289.0

Nationally, the highest yielding corn field was grown by Randy Dowdy of Valdosta, GA. He used AgriGold A6499STX/RIB to yield 521.4 bu/A. The highest recorded corn yield in the world was recorded in 2015 by David Hula of Charles City, VA, who grew 532.0 bu/A using Pioneer P1197AM. In Wisconsin, the highest recorded corn yield was grown in 2012 by Jeff Laskowski of Plover who grew Pioneer P0533AM1 that yielded 327.1 bu/A.

For more information on the results of this NCGA program, see http://www.ncga.com/for-farmers/national-corn-yield-contest.

Monday, November 28, 2016

State Crop Hybrid/Variety Trials: A Wealth of Information

Seed is one of the best ways to transfer technology to the farm-gate. Every year universities across the country conduct crop hybrid/variety evaluation programs. The purpose of these programs is to provide unbiased performance comparisons of crop varieties and hybrids available commercially to farmers. These trials are important because slight increases in yield can translate into huge economic impacts for farmers. For example, a one bushel increase by U.S. corn farmers across 90 million acres increases farm income $180 to $450 million depending upon corn price ($2 to $5 per bushel). Recent corn yields have been increasing at the rate of 2 bushels per acre year.

Click below to get the latest crop hybrid/variety results.

State Corn Soybean Wheat All
Colorado 2016 --- 2016 2016
Iowa 2016 2016 --- 2016
Illinois 2016 2016 2016 2016
Indiana 2016 2016 --- 2016
Kansas 2016 2016 2016 2016
Kentucky 2016 2016 2016 2016
Michigan 2016 2016 2016 2016
Minnesota 2016 2016 2016 2016
Missouri 2016 2016 2016 2016
Nebraska 2016 2016 2016 2016
North Dakota 2016 2016 2016 2016
Ohio 2016 2016 2016 ---
Pennsylvania 2016 2016 2016 ---
South Dakota 2016 2016 2016 2016
Wisconsin 2016 2016 2016 ---

Friday, November 18, 2016

2016 Wisconsin Corn Hybrid Performance Trials


2016 Wisconsin Corn Hybrid Performance Trials
Grain - Silage - Specialty - Organic

Every year, the University of Wisconsin Extension-Madison and College of Agricultural and Life Sciences conduct a corn evaluation program, in cooperation with the Wisconsin Crop Improvement Association. The purpose of this program is to provide unbiased performance comparisons of hybrid seed corn available in Wisconsin. These trials evaluate corn hybrids for both grain and silage production performance. In 2016, grain and silage performance trials were planted at fourteen locations.

Situation: A one bushel increase by Wisconsin corn farmers increases farm income $8 to $32 million dollars depending upon corn price.

Objective: To provide unbiased performance comparisons of hybrid seed corn available in Wisconsin.

These results are a ''Consumer Report'' for commercial corn hybrids. The trials evaluate grain, silage, and systems including organic, transgenic and refuge systems.

Monday, October 31, 2016

Early 2016 Corn Grain Yields Look Promising for Wisconsin

We have never had a year like 2016  for high grain yields in the UW Corn Performance Trials. Every location had yields above the 10-year average (see below). For example, at Arlington over the previous 10-years (2006 and 2015) we have tested 1501 corn hybrids with an overall yield average of 232 bu/A. In 2016 we tested 127 hybrids which produced an average yield of 258 bu/A, an 11% increase over the previous 10-year average. This year corn hybrids at Arlington, Montfort, Chippewa Falls, Marshfield, Seymour, Valders, Coleman and Spooner produced a yield increase of more than 10% over the 10-year average.

This year is unique because usually at one or more locations, corn yields are below the 10-year average and the percent change column is negative. Stay tuned for publication results of individual hybrids and the top performances of 2016.


Friday, September 30, 2016

What is happening in the corn plant during the month of October?


For most of Wisconsin hybrids (~100 day), each plant typically develops 20-21 leaves, silks about 55-60 days after emergence, and matures about 120 days after emergence. All normal plants follow this same general pattern of development, but specific time intervals between stages and total leaf numbers developed may vary between different hybrids, seasons, planting dates and locations. The rate of plant development for any hybrid is directly related to temperature, so the length of time between the different stages will vary as the temperature varies. Environmental stress may lengthen or shorten the time between vegetative and reproductive stages. The length of time required for the yield components of ear density, kernel number, kernel weight varies between hybrids and environmental conditions.

During October, frost has no effect on yield. However, lodging from disease, insect damage or hail can result in physical loss of yield. Grain harvest usually begins at about 25% grain moisture and is completed by 20% grain moisture. Some grain drying is usually necessary to get moisture down to 13-15% for long-term storage.

Yield
Ears per unit area, kernel number per ear and kernel weight all contribute to yield. These yield components of corn are determined early in the life cycle of the corn plant. It is true that yield is the end product but the plant must go through a number of stages to produce yield. Understanding this process won't necessarily put "money in your pocket", but by knowing when yield components are determined helps to interpret management and environmental factors influencing yield.

Ear number, kernel number and kernel weight are determined at six critical stages: at planting and emergence (VE-V4) when the potential number of ears in an acre is at a maximum; when the ear sets the maximum number of kernel rows (V5-V6); when the ear sets the maximum number of kernels along length of the ear (V15-VT); when the maximum number of ovules are pollinated to form developing embryos (R1-R2); when the maximum number of kernels is determined (R4-R5); and when the maximum kernel size is established (R5-R6).

Figure 1.Yield Components of Corn.

Moisture
While corn grain yield is determined over the full season, at some point during the growing season yield is no longer the main production objective. Rather grain moisture becomes the main production focus and directly influences grain quality during storage. Grain quality is often established by conditions at the very end of the growing season. During wet fall weather growers need to move quickly on deteriorating grain.

  Table 1. Maximum storage time (months) of corn.*

Temperature (°F) Corn moisture content
13% 14% 15% 16% 17% 18% 24%
40 150 61 29.0 15.0 9.4 6.1 1.3
50 84 34 16.0 8.9 5.3 3.4 0.5
60 47 19 9.2 5.0 3.0 1.9 0.3
70 26 11 5.2 2.8 1.7 1.1 0.2
80 15 6 2.9 1.6 0.9 0.9 0.06
* Based on 0.5% maximum dry matter index - calculated on the basis of USDA research at Iowa State University. Corresponds to one grade number loss, 2-3% points of Total Damaged grain.


Post mortem
The corn ear can tell us much about a plant’s development during the growing season. Abnormal ear development has multiple causes – environmental stresses, pests, cultural practices. Combined with information on field history, knowledge of ear and kernel anomalies can be an effective diagnostic tool in troubleshooting corn production problems. Understanding how corn ears respond to stress can help determine the nature of the stress, when it occurred, and how it might be managed or avoided in the future. See “Troubleshooting Abnormal Corn Ears" at http://u.osu.edu/mastercorn/.

October is also the month to learn how your management style interacted with the environment. It is the time to evaluate your on-farm trials and observations. It is important to write down these observations about how your land responded to your management and decisions you made this past year.

Wednesday, August 31, 2016

What is happening in the corn plant during the month of September?


In mid-August, USDA-NASS made their initial corn yield projections for the 2016 season. However, September is really the month when we project how our farming skills and previous decisions come together to produce a corn crop. By this time, yield becomes secondary because the season and growth of the crop is largely over. A lot can still happen, but the focus of many decisions are based upon plant and grain moisture.

During September, the crop has usually dented and the kernel milkline is progressing towards the kernel tip. Physiological maturity is reached when all kernels on the ear have attained their dry matter maximum accumulation. Eventually a black abscission layer forms indicating that moisture and nutrient transport from the plant has ceased. Once physiological maturity (R6-Black layer) is achieved it is a physical process to dry the grain down to a harvest moisture between 20 and 25%.

Husk leaves turn color and ears begin to droop. Most modern hybrids have the stay-green trait which allows for better stalk quality and standability in the field. High yielding years  often put stress on the plant due to "stalk cannibalization" where nutrients are translocated to developing kernels at the expense of stalk health.

Figure 1. Normal Pattern of Corn Forage and Grain Development

If ensiling can be used to store grain, then corn silage or high moisture grain can be harvested. Silage harvest would be slightly earlier than R6 as milkline moves down towards kernel tip (Figure 1). High moisture corn is usually harvested shortly after R6. Frost has no effect on yield at this point. However, lodging from disease, insect damage or can result in physical loss of yield. 

September is the month when corn silage is harvested in Wisconsin. Silage choppers put a lot of material through a relatively small opening cutting (or shredding) plants to 3/4 inch TLC along with kernel processing to break kernels. Usually the window to harvest corn silage is about 7 to 14 days depending upon the maturities of the hybrids selected at planting. Owning your own chopper provides more flexibility for timing harvest. If dealing with custom silage choppers it is imperative to communicate accurately the whole plant moisture of your fields and the rate of drydown. Adjustments to silage moisture can still occur by raising or lowering the cutter bar because the driest part of the plant is the grain.

During September, dry grain is usually not ready for safe storage; it needs to be at 13-15% moisture for long-term storage. It may be advantageous to let crop partially dry in the field.

Thursday, August 25, 2016

Timing Corn Silage Harvest


Corn must be ensiled at the proper moisture to get fermentation for preservation. But, determining when to harvest corn at the right whole plant moisture is difficult. Each storage structure properly ensiles at slightly different plant moisture optimums. Harvesting corn too wet for the storage structure will result in reduced yield, souring and seepage of the ensilage, and low intake by dairy cows. Harvesting too dry reduces yield, can cause mold to develop, and lowers digestibility, protein and vitamins A and E.

Kernel milk is not a reliable guide for timing silage harvest

Dry matter content of whole plant corn varies with maturity. The position of the kernel milk-line is not a reliable indicator for determining harvest timing. Geographic location, planting date, hybrid selection, and weather conditions affect the relationship between kernel milk-line position and whole plant dry matter content.

Determining field harvest order and initial plant sampling

The first step to determine when a field is ready for harvest is to note the order in which you planted your fields. Next, note silking dates of the fields to project calendar days to when a field will mature. Once corn silks, approximately 55 to 60 days is required to achieve maturity at R6 or the "black layer" stage (Abendroth et al., 2011). Development during grain filling is influenced by temperature, but not as much as during the vegetative leaf emergence stages. Instead the number of days between pollination and a killing frost influence the time to maturity. So if an average killing frost occurs October 1, then subtracting 55 to 60 days means that the crop must be silking by August 2-7.

We know that kernel milk stage is not reliable for determining the actual harvest date, but it is a useful indicator of when to sample fields to measure plant dry matter. Silage harvest usually begins around 50% kernel milk which is 42 to 47 days after silking, so silking must occur by August 15-20 in order to mature before typical killing frost dates; but remember that the timing of silage harvest is dependent upon achieving the proper moisture for the storage structure (Table 1). Noting the order that fields silk will help plan the harvest queue of your fields and scheduling of custom choppers.


Table 1. Kernel milk stage "Triggers" for timing silage harvest
Silo Structure Ideal Moisture Content Kernel Milk Stage "Trigger"
  % %
Horizontal bunker 70 to 65 80
Bag 70 to 60 80
Upright concrete stave 65 to 60 60
Upright oxygen limiting 50 to 60 40
"Trigger": kernel milk stage to begin checking silage moisture.

Determining Silage Moisture

The only reliable method of determining the optimal time to harvest corn silage is to sample the crop and directly measure the % dry matter of whole plants. This information combined with average whole plant dry-down rates can be used to roughly predict the proper time to harvest corn silage.

The next plant indicator that determines the order of fields to harvest is movement of the kernel milkline. Once kernel milkline begins to move, measure moisture of fields intended to be harvested for silage (Table 1). Corn should be first sampled to measure dry matter shortly after full dent stage (80% kernel milk) for bunker silos and bags, at 60% kernel milk for conventional tower silos, and at 40% kernel milk for sealed (oxygen-limited) tower silos. It is important to begin sampling early as a precaution against variation in dry down.  You will likely be too wet, but you will have an indication of how quickly drydown is occurring when the next sampling date takes place.

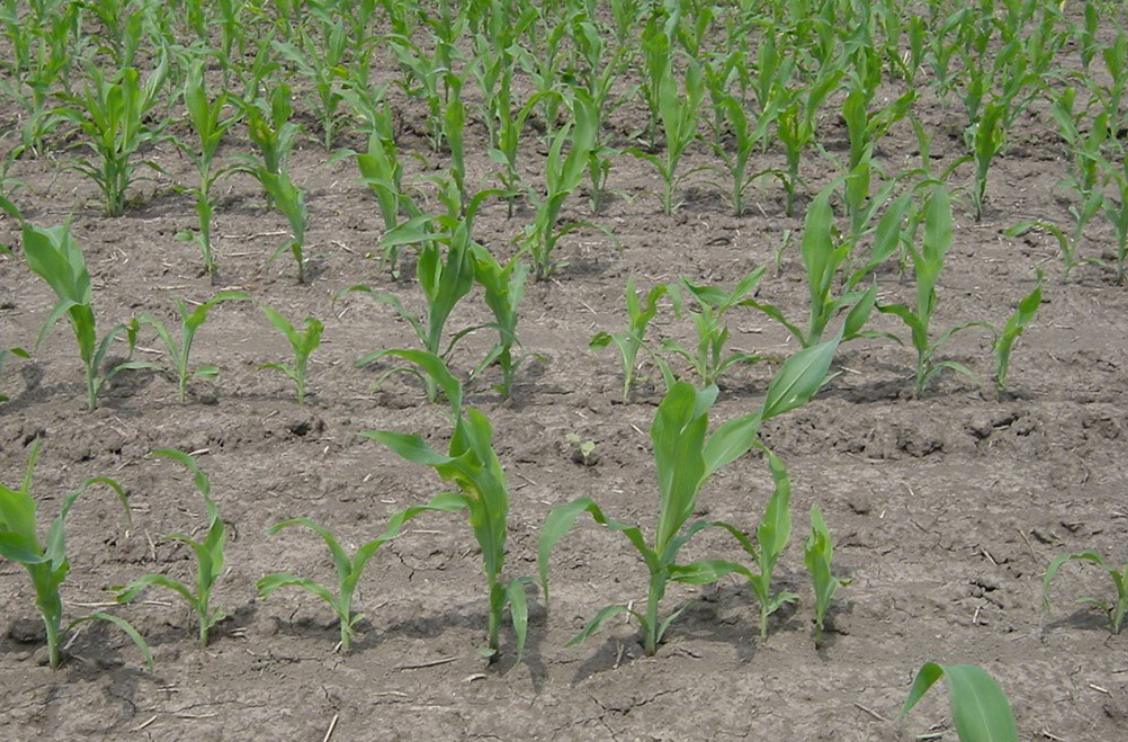
Sampling a field for whole plant moisture 

Ideally the field to be harvested is uniform in development, but the reality is that uniformity is rarely achieved. Separate uneven fields into representative groups. Figure 1 describes the moisture drydown patterns of two locations in the same field. Knoll areas were as much as 20% units different from swale areas.

 Figure 1. Forage moisture of corn growing on a knoll and a swale at Arlington during 2003.

Sample two or more locations for each representative group in the field. Over time, sample the same locations - trying to determine the rate of drydown. Scott Hendrickson (Manitowoc county agent) measured whole-plant moisture over time at three sites in the county by always returning to the same location in the field (Figure 2). Depending upon year the average drydown rate ranged from 0.4 to 0.7 percent per day.
Figure 2. Corn silage drydown during harvest (Hendrickson, Manitowoc County, WI)

Procedure for measuring plant moisture
  1. Sample 3 to 5 plants in a row that are well bordered and representative.
  2. Put in plastic bag,
  3. Keep plants cool,
  4. Chop as quickly as possible,
  5. Measure moisture using NIR spectroscopy and/or by drying using a, Koster oven, microwave, or convection oven (Peters, 2000).
Predicting silage harvest date

Use 0.5% per day during September to predict the date when a field will be ready for the storage structure. For example, if a given field measures 30% dry matter at the early sampling date, and the target harvest dry matter is 35%, then the field must gain an additional 5% units of dry matter, thus requiring an estimated 10 days (5% units divided by 0.5 unit change per day). If weather is warm and dry, use a faster rate of drydown (1999 and 2000 in Figure 2). If weather is cool and wet, use a slower rate of drydown (1996 and 2001 in Figure 2). We are most interested in the rate of corn silage drydown. Wisconsin county agents have been accumulating corn silage drydown information since 1996. Results from county "Drydown Days" can be checked at the website http://fyi.uwex.edu/silagedrydown/ which averages and predicts area harvest dates.

This procedure provides only a rough estimate for the harvest date. Many factors affect dry down rate, including hybrid, planting date, general health of the crop, landscape position, soil type, and weather conditions. In general, corn silage that is slightly too dry is worse than corn silage that is slightly too wet. Therefore, starting harvest a little early is usually better than waiting too long.

Literature Cited 

Peters, J. 2000. On-Farm Moisture Testing of Corn Silage [Online]. Available at http://fyi.uwex.edu/forage/files/2014/01/CSMoistTest-FOF.htm_.pdf (verified 25 August 2016). Focus on Forages, UW-Madison.

Abendroth, L.J., R.W. Elmore, M.J. Boyer, and S.K. Marlay. 2011. Corn growth and development. PMR1009. Iowa State University.

Sunday, July 31, 2016

What is happening in the corn plant during the month of August?

By August two of three corn yield components, ear number and kernel number, have been determined. The final yield component, kernel weight, will largely be determined during the month of August. Preliminary yield estimates can be made and depending upon the success of pollination, decisions regarding harvest use strategies can be planned.

Corn kernel development begins with silking (R1) and is marked by the blister stage (R2), milk (R3), dough (R4), and dent (R5) stages. The final stage called black layer formation (R6) marks the end of kernel development. The corn kernel accumulates weight in a sigmoidal pattern over a 55-60 day period beginning with a 7-10 day "lag" phase and ending with a 7-10 "maturation" phase (Figure 1). The linear phase of the sigmoidal curve lasts about 40 days.

Figure 1. Kernel weight accumulation pattern of corn.

For a 200 bushel per acre yield level about 5 bushels per day (200 / 40) accumulates during the linear phase of kernel development. About 60% of the starch that accumulates within the kernel is produced by the ear leaf. Leaves above and below the ear are also important sources for developing kernels, but as the distance from the ear increases less starch is translocated to kernels and more to other plant parts. The stalk serves as a temporary storage organ during the day and photosynthate will be translocated to the kernels throughout the night.

Photosynthesis is maximized at about 1/3 of full sunlight, so even cloudy days can produce the starch needed to sustain accumulation in the kernel. Other plant parts (leaves, stalk and roots) demand photosynthate for respiration and are competitors with kernels. Temperatures that are comfortable for us (65-80 degrees F during the day and 50-65 degrees at night) provide the best trade-off between maximizing photosynthesis production and minimizing respiration in corn.

About 0.25 to 0.30 inches of water is being transpired by the plant during August. Every day that corn plants are stressed can lower yields 5% per stress day. Nutrients (N-P-K) are still being taken up by the plant until about the R3 to R4 stages. Brace roots are acting as a nutrient scavenger system in the upper layers of the soil profile, while roots deeper in the profile are used primarily for water uptake. During August it is important to protect the ear leaf since that is the plant part where most of the photsynthate is produced for a developing kernel.

Wednesday, June 29, 2016

What is happening in the corn plant during the month of July?


The corn plant during July transitions from developing vegetative structures to reproductive structures. It is significant for yield in that two of the three components of yield are set up during this month. In the first half of the month, the number of potential ovules that could develop into kernels is determined. In the second half, the number of potential cells in the kernel endosperm, which ultimately affects kernel weight, is determined. However, everything is predicated on the success of pollination and fertilization of the ovules on the topmost ear from pollen released by the tassel (see "Methods for determining corn pollination success").

During early July ear development is rapid and prior to tasseling (V18). The upper ear shoot is developing faster than other shoots on the stalk. Brace roots are now growing from nodes above the soil surface. They will scavenge the upper soil layers for water and nutrients during reproductive stages. Moisture deficiency will cause lag between pollen shed and beginning silk ("nick"). Usually the largest yield reductions will result from this stress. The plant is using 0.30 inches of water per day. Lodging will cause 12-31% yield reduction. Frost (<28 F) will cause 100% yield loss due to plant death (see "Frost"). Hail will cause 100% yield loss when completely defoliated (see "Hail damage on corn"). Drought will cause 4% yield loss per day due to drought or heat when leaf rolling occurs by mid-morning (see "Drought"). Flooding (<48 h) will not affect yield, however, other management options need to be considered (see "Flooding effects on corn").

At the silking (R1) stage the actual kernel number and potential kernel size is determined. R1 begins when any silks are visible outside the husks. Pollen shed begins and lasts 5-8 days per individual plant. Silk emergence takes 5 days. Silks elongate from base of ear to tip of ear. Silks elongate until pollinated. Silks outside husks turn brown. The plant has now reached its maximum height. First 7-10 days after fertilization cell division occurs within kernel after which kernels begin to fill with starch.

The plant must have a healthy root system because proper uptake of moisture and nutrients are critical at this time. Hot and dry weather results in poor pollination and seed set. Drought dehydrates silks (delaying silking) and hastens pollen shed causing plants to miss window nick for pollination. Drought decreases yield 7% per day (leaf rolling by mid-morning). Rootworm beetle clips silks which prevents pollination if less than a half-inch of silk is showing

Nitrogen applied through irrigation water, should be applied by V18. Rootworm beetle control should be implemented if 4-5 beetles are observed feeding near ear tip. Stresses that reduce pollination result in a "nubbin" (an ear with a barren tip).

Wednesday, June 1, 2016

What is happening in the corn plant during the month of June?


Corn planting was nearly complete by the end of last week. As we head into the month of June, the corn plant changes from a juvenile to more of an adult. The seminal roots that originated in the seed are dying and the nodal roots are becoming the dominant root system which will eventually occupy a cylindrical volume roughly 5-6 feet in diameter and 5-7 feet deep depending upon soil characteristics.

Another change is occurring on the leaves. Juvenile leaves have cuticular and epicuticular wax on the surface giving the leaf a bluish cast. The V5-V7 leaves have decreasing amounts of epicuticular wax leaving only the glossy green cuticular wax commonly seen on adult leaves. By V8 the transition from juvenile blueish cast to adult glossy green wax is complete.

By V6 (about 24-30 days after emergence - 475 GDU) all plant structures have developed on the growing point. All plant parts are present. The growing point and tassel, differentiated in V5, are above the soil surface. The stalk is beginning a period of rapid elongation getting taller. The determination of kernel rows per ear begins and is complete by about V10-V12. This yield component is strongly influenced by hybrid genetics. Tillers (suckers) begin to emerge at this time. Lower leaves degenerate and are torn from the stalk as it expands. During early June there is a new leaf emerging (V-stage) about every 3 days.


June is the time to apply nitrogen (up to V8) before rapid uptake period in corn. Precise fertilizer placement is less critical. Lodging can often occur during this time since brace roots have not appeared. Rootworm eggs will soon hatch and larvae begin feeding on root systems. Defoliation from hail ,wind, and leaf feeding corn borers may decrease row number on the ear. If a frost would occur during June there would be 100% yield loss caused from plant death and killing of the growing point. Hail can cause up to 53% yield loss when completely defoliated. Short-term flooding can cause severe yield loss if the growing point is below the water surface.

By V12 ( 42-46 days after emergence - 815 GDU) potential kernel rows are determined. The number of kernel rows is set. The number of ovules (potential kernels) on each ear and size of ear is being determined and is strongly affected by environmental stresses. During late-June there is a new leaf emerging every 2 days and brace root formation begins stabilizing the upper part of the plant. The plant is utilizing 0.25 inches of water per day. Nutrient deficiencies, will reduce the potential number of kernels and ear size. Large amounts of nitrogen, phosphorous, and potassium are being utilized at this stage. Early hybrids- progress faster through growth stages and usually have fewer leaves and smaller ears than late hybrids.

For most of Wisconsin hybrids (~100 day), each plant typically develops 20-21 leaves. The rate of plant development for any hybrid is directly related to temperature, so the length of time between the different stages will vary as the temperature varies.  Environmental stress may lengthen or shorten the time between vegetative and reproductive stages. The length of time required for the yield components of ear density, kernel number, kernel weight varies between hybrids and environmental conditions.

Ears per unit area, kernel number per ear and kernel weight all contribute to yield. These yield components of corn are determined early in the life cycle of the corn plant with some established by the end of June.

Tuesday, May 24, 2016

Strip-Tillage: How does it affect yield in Wisconsin?

Farmers in Wisconsin are often challenged by cool, wet soils in the spring. Many farmers will chisel plow and field cultivate (2x) to prepare a seedbed to overcome these typical soil condition challenges. Over the last 40-50 years some farmers have sought ways to be less aggressive with tillage leaving more residue on the soil surface to protect it from erosion. Often though there is a "yield penalty" for growing corn in reduced tillage and no-till, especially for continuous corn.


Strip-till is considered a variation of no-till. The Conservation Technology Information Center's definition of no-till includes strip-till, provided less than one-third of the total row area is tilled. In strip-till, an 8-inch band in a 30-inch row spacing is aggressively tilled and fertilized using fluted coulters, knives and berm-forming baskets in either the fall or spring. The objective is to dry out and warm up soil in the seed placement zone before spring planting to encourage more uniform stand emergence and plant density.

In the fall of 2000, we initiated a tillage trial to evaluate the impact of strip-tillage on corn yield. The most aggressive tillage operation in the trial was chisel plow followed by two field cultivator operations, while the least aggressive tillage operation was no-till which used a single 13-wave fluted coulter and trash whippers on the planter. Four strip tillage treatments based on tool aggressiveness were applied. Treatment ST4 was the most aggressive strip tillage treatment (9-inch knife, 3 13-wave coulters and berm forming baskets). The strip-tillage treatments varied through the early years of the trial, however, from 2007 to 2015 the treatments were consistent. For Figure 1, we considered 2007 a "set-up" year and deleted it from the analysis. We analyzed 8 years of data (four 2-year cycles for the corn-soybean rotation)

Figure 1. Corn grain yield response to no-till, strip-till and conventional tillage systems. Data are derived from 2008-2015 at Arlington,WI. Values are means of all split-split-plot treatments. (click to enlarge)
No-till continuous corn yielded the least among the treatments at 164 bu/A. This treatment was used to compare all other treatments as a relative percentage. No-till in rotated corn yielded 6% more than no-till continuous corn (NT CC). Chisel plowing yielded 9-12% more than NT CC. Treatment ST4, yielded 9-10% more than NT CC. All of the strip-tillage treatments, except ST1 (the least aggressive tillage treatment) in continuous corn, yielded more than NT CC and were comparable to conventional tillage. These data are some long-term evidence that strip-tillage can overcome cool, wet soils in the spring and have the potential to protect soil from erosion with little impact on grain yield.

Further Reading
Tillage and No-Tillage Systems. http://cropwatch.unl.edu/tillage

Wednesday, May 18, 2016

How long can we continue to plant corn in 2016?

With average growing conditions corn planted after June 1 to June 5 in northern and central Wisconsin and after June 10 to June 15 in southern Wisconsin, will probably not mature with reasonable grain yield and moisture content, even with very early hybrids. However, corn silage from shorter-season hybrids may still have acceptable quality when corn is planted until June 20. Corn planted after June 20 will likely contain little or no grain, and only stover (stems and leaves) will be produced. Table 1 lists alternate hybrid Relative Maturities for delayed planting dates for the standard Relative Maturity belts shown in Figure 1.

Figure 1. Relative maturity zones (in days and Growing Degree Units - GDUs) for full-season corn hybrids planted before May15. (click to enlarge)


Table 1. Relative maturity of adapted corn hybrids for different planting dates and relative maturity zones. Derived from UWEX A3353 - Corn Replant/Late-Plant Decisions in Wisconsin. (click to enlarge)

Pest Control

It is usually easier to control weeds in late corn plantings than in early plantings. Late tillage kills many germinated weeds and crop seedlings are more competitive due to warmer temperatures. For replant situations, weed control must take into account any previous herbicide applications. If herbicides were applied pre-emergence or pre-plant incorporated, their effectiveness may be reduced by the time corn is replanted, especially if the field is tilled before replanting.

Insects normally are a greater threat to late plantings than weeds. Later plantings may have more feeding from second-generation European corn borers, and silk feeding by corn rootworm beetles may also be more severe. Soil rootworm insecticide will need to be applied if the field was tilled since the initial planting application.

Effects of Early Freeze on Yield Potential

Earlier than normal autumn frosts can devastate late-planted corn. Yield is decreased if late-planted corn does not reach physiological maturity before plants are damaged by a freeze. Grain from corn plants killed by a freeze before maturity may be slow to dry down, and it tends to be brittle after artificial drying -- making it more likely to break during handling. Test weight also will be lower when corn is prematurely killed.If late-planted corn does mature ahead of frost, grain will be wetter and probably have to dry down in weather less favorable for drying. The following lists grain characteristics and appropriate management considerations for corn killed at various growth stages:

Corn Killed in Dough Stage
 Kernels contain about 70% moisture. About one-half of mature kernel dry weight accumulated. Grain will unlikely achieve maximum yield potential unless stalk, ear and some lower leaves survive. Corn can be used for good quality silage, but entire plant must be allowed to dry to about 65% moisture.

Corn Killed in Dent Stage
 In early dent, kernels contain about 55% moisture; are 3 to 3.5 weeks from maturity; and about half of mature dry weight has accumulated. In late dent, kernel moisture is decreasing and yield is within 10 percent of final mature dry weight when kernels are past half milkline. Corn will make good silage when harvested at a whole plant moisture content of 65%. Can be harvested for grain after long field-drying period. Grain yields will be reduced and test weights low. If plant is only partially killed or the crop is close to physiological maturity before the freeze (kernel milk line half-way or closer to tip), yield loss will be only 5 to 20 percent, and test weight will be lower.
Corn Killed When Physiologically Mature (Black Layer)

Kernel moisture is 28 to 35% depending on hybrid. Killing freeze will not affect grain yield or quality. Dry-down rate of grain depends on hybrid and environment.

Crop Choice 

If planting is delayed past the time acceptable corn production can be expected, consider planting an alternative crop. Compare the relative yield potential and current price of an alternative crop for a given date with that of late-planted corn.

For example, corn yield potential of a late planting declines at a faster rate than the yield potential loss of soybeans. After June 1, it may be advantageous to plant soybeans, instead of corn, if this fits your rotation. Sunflowers and buckwheat are other grain crops that can be planted very late. Forage sorghum, sorghum-sudan crosses or sudangrass can help boost forage supplies and be planted into July. You must consider prior herbicide and fertilizer applications, desired rotation, livestock feed requirements, and the possibility of erosion on slopes when you are choosing a crop to plant late. For more information on herbicide rotational restrictions, see UW Extension publication A3646 -- Field crops pest management in Wisconsin.

Monday, May 16, 2016

Frost on Corn: The Key is Patience

This past weekend significant areas of northern Wisconsin were affected by frost with temperatures below 28 F. Most corn has either not emerged or is just starting to emerge. The key management practice here will be patience. It will take some time to determine if corn was damaged by this frost.

Corn plants will not be killed by frost unless temperatures get cold enough to kill the growing point that is 3/4 of an inch below the soil surface. So corn that has not emerged typically is well insulated from frost damage. So corn that has not emerged typically is well insulated from frost damage.
Frost should not be a problem with corn until the growing point moves above-ground around V5 to V6. Farmers and agronomists usually do not worry about frost at these early stages of development. Early frost can have an impact on grain yield, but the trade-off between planting date impact on yield is greater than for frost damage impact on yield. Delayed planting further impacts profitability due to greater moisture and consequential drying costs.

Symptoms of frost damage will start to show up about 1 to 2 days after a frost. Symptoms are water soaked leaves that eventually turn brown. After 3 to 4 days watch for new green leaves emerging n the whorl. If new leaves are not emerging check the growing point for discoloration. Any deviation from a white, cream or light yellow color indicates that the growing point is killed.

To measure the impact of early defoliation on corn grain yield corn plants were clipped with a scissors. Clipping treatments were applied at V2, V4 and V6. Plants in the control treatment were not clipped. In another treatment, all plants in the plot were clipped. In another set of treatments, half of the plants were clipped in 2-, 4-, and 8-plant patterns. For example in the 2-plant pattern, the first 2 plants in the row were not clipped, the next 2 plants were clipped at ground level, the next 2 plants were not clipped, and so on.
Figure 1. Impact of clipping corn leaves at V2. Experiments were conducted in 2001, 2002, 2003, 2004, and 2005 at Arlington, WI. Treatments consisted of clipping at ground level (or not clipping) consecutive plants in 2-, 4-, 8-, and all-plant patterns.

Although these treatments do not fully simulate the frost damage, they do provide some guidance on what a frost might do that completely defoliates the plant without killing it. Figure 1 describes the impact of complete defoliation on corn grain yield at the V2 stage of development. When all plants were clipped, grain yield decreased 17 bu/A from 210 to 193 bu/A (8%). When half of the plants were clipped in various patterns, grain yield was not affected; the trend was a decrease of 8 to 9 bu/A (4%).

These data indicate that frost early in development has relatively little impact on corn grain yield. If all of the leaves are removed from every plant in the field at the V2 stage of development and plants are not killed, then the expectation is that grain yield would decrease up to 8%. If the recent frosts were hard enough to kill plants then use the publication UWEX 3353 for guidance on whether or not to keep a stand and what to look for when assessing plant health.

Further Reading
Frost effects on corn
Corn replant/late-plant decisions in Wisconsin UWEX 3353

Wednesday, May 11, 2016

To replant, or not to replant, that is the question.


Farmers are faced with replanting decisions every year. Cold temperatures, wet or crusted soils, and/or pesticide or fertilizer injury may reduce seed germination and seedling emergence. After emergence, stands may be further reduced from insects, diseases, wind, frost, hail, and/or flooding. Stands too dense or non-uniform because of planter malfunctions or variable seeding depth may warrant replanting.

The major decision facing a farmer is whether it is more profitable to keep the original stand using a full-season hybrid or replant. Replanting may result in an optimum stand, but it would be planted at a later than desired date using a shorter season hybrid.

To minimize losses, information must be collected and evaluated quickly. You'll first need to estimate three factors: stand population, plant health, and evenness of spacing. Then compare the yield potential of the existing stand to the yield potential of a late-planted stand. When deciding whether to replant, you'll also need to consider replanting costs, seed availability, rotation restrictions from previous herbicide applications, and possible alternative crops. Base your replant decision on proven agronomic facts rather than emotion.

Steps in the process:
  1. Determine plant population
  2. Evaluate plant health
  3. Assess the unevenness of stands
  4. Compare the yield of a reduced stand to that of a replanted stand
  5. Calculate replanting costs
  6. Factor in risks of replanting

Further Reading
Corn Replanting
Corn Replanting or Late-Planting Decisions UWEX Bulletin A3353
Uneven emergence in corn NCR344

Monday, May 9, 2016

What is happening in the corn plant during the month of May?


Good progress has been made planting corn in Wisconsin. Corn planted was at 56 percent complete, one day behind last year, but 10 days ahead of the five-year average.  Corn emerged was at 6 percent, the same as last year, and 4 days ahead of the five-year average. There was some concern that corn planted before April 20 might have experienced some imbibitional chilling due to cool weather towards the end of April. However, the crop has emerged well and there is currently more concern about black cutworm damage.

Corn seed is usually planted between 1.5 and 2 inches deep. For the first 24-72 hours after dry seed is planted into the ground, all that takes place is physical imbibition of water into the seed. Water and oxygen move slowly into the kernel through the pericarp. Membranes re-hydrate and hormones and enzymes are activated. Imbibitional chilling occurs when membrane re-hydration is disrupted by free radicals. Cold water is much more disruptive than warm water. Sugars and salts leak from the cells and kernel providing a food source for pathogens and other microbes.

After the seed swells, enzymes begin to breakdown starch in the endosperm. Sugars supply the embryo with energy for metabolism and cell division. The first structure to emerge is the root radicle. The plumule, which consists of the coleoptile and first leaves emerges from the seed and then from the soil. Elongation of the coleoptile ceases at the soil surface (VE) and elongation of mesocotyl ceases. The first leaves rupture the coleoptile tip. It takes about 7-10 days (125 Growing Degree Units - GDUs) for the VE stage to occur.

Emergence (VE) is affected by a number of factors. If conservation tillage is implemented add 30-60 GDU to VE. If the planting date is before April 25 add 10-25 GDU to VE. If planting date is  after May 15 subtract 50-70 GDU to VE. If the seeding depth is below 2-inches then add 15 GDU to VE for each inch below 2 inches. If the seedbed condition is crusted or cloddy then add 30 GDU to VE. If the seed-zone soil moisture is below optimum, add 30 GDU to VE.

Shortly after the radicle emerges from the seed, seminal roots emerge and supply water and nutrients to the developing seedling. These roots are also important for nutrient uptake of pop-up and starter fertilizer. Seminal roots begin to die between V2 and V4. Nodal roots become the primary root system of the plant and arise from below-ground nodes near the growing point around V2.

Banding small amounts of starter fertilizer to the side and slightly below the seed can improve early vigor, especially when soils are cool. However, little evidence supports use of pop-up or starter fertilizer for increasing grain yield in many soils in Wisconsin.

Figure 1. Corn plant parts at V2. Photo from Iowa State University publication
("How a corn plant develops"-Special Report No. 48-Ritchie, Hanway and Benson, 1996)

Once the leaves emerge from the coleoptile, the seedling begins photosynthesis. The growing point is below the soil surface. All of the growth and development for above-ground plant parts is taking place on the growing point. This continues until V5-V6 (about the end of May). Frost at this time will not affect yield (<28 F). Hail will not affect yield. Severe yield losses can occur from flooding when plants are under water for more than 48 hours.

Troubleshooting
  1. Watch for seed attacking insects
  2. Germination and emergence is delayed when there is inadequate moisture and /or cool soil temperatures (<50°F) 
  3. If the first leaves unfurl below-ground, the seed was planted too deep, and/or the soil is cloddy or crusted.
  4. Herbicide injury: coleoptile will be corkscrew shaped, and have swollen mesocotyl.

Wednesday, April 20, 2016

Looking ahead to 2016: Planting date decisions

We started planting corn on April 14. Recent planting progress statistics from USDA-NASS indicate that corn planting is progressing slowly in the northern Corn Belt. Only 1% of corn acres had been planted in Wisconsin as of April 17.

The date that produces maximum corn grain yield varies by field, tillage practice, hybrid and latitude. Every year since 1991 we have established a planting date experiment at Arlington, WI. On this farm, if you could plant all of your corn on one date and wanted to maximize yield, then the best date would be May 1 (Figure 1). As expected, we have observed a step increase for yield every decade. However, the maximum yield planting date has not shifted much (April 28 to May 4). The economic optimum is going to be earlier than these dates, because typically earlier planted corn is drier at harvest. The planting date "window" when we can be within 95% of the maximum yield is between April 18 and May 16. Grain yield decreases 0.5 bu/A per day on May 15 and accelerates to 2.5 bu/A per day on June 1.

For southern Wisconsin we typically recommend to begin planting anytime after April 20 as long as field conditions are fit. For northern Wisconsin anytime after April 30 is appropriate. Soil temperature is not a consideration after these dates. However, we do pay attention to the short-term weather forecast. If cold, wet conditions within 48 to 72 hours of planting are predicted, it is prudent to wait until weather is more favorable. We lost trials at Seymour and Fond du Lac in 2006 when we planted ahead of a snow storm; the only corn that survived was over the drain field. This phenomenon is called imbibitional chilling. There is not a lot of field data to support this practice and it has only happened to us twice over the last 20 years. The challenge as to when to begin planting, is what to do between April 10 when insurance coverage starts and the typical April 20 (southern) and April 30 (northern) start dates. Soil temperature is a good guide during this period. Corn doesn't grow much when temperatures fall below 50 degrees F.

Figure 1. Corn grain yield response to planting date by decade at Arlington, WI. The 1970s included data from experiments conducted during 1974, 1976, 1977, and 1978; 1980s included 1980 and 1981; 1990s included 1991 to 1999; 2000s included 2000 to 2009; 2010s included 2010 to 2015. (click to enlarge)

Thursday, April 14, 2016

Looking ahead to 2016: Plant density decisions

I have been receiving many questions this year regarding the "correct" plant density for corn. Growers are concerned about 2016 production economics and one input they are looking at is seeding costs related to plant density in the field. The optimum plant density is influenced by both seed cost and grain price. As seed costs increase and/or grain price decreases the "correct" plant density shifts lower.

Every year since 1982, plant densities have been increasing by about 300 plants/A. Seed costs during the 1980s were about $20/A and plant densities were a little over 20,000 plants/A. Today seed costs are over $100/A with USDA-NASS plant densities around 30,000 plants/A. Today a typical 80,000 (80K) count bag of seed costs $300/bag, so each 1000 plant/A adjustment means $3.75/A.

The best way to approach the decision to determine the "correct" plant density for a field is to find the plant density where the maximum yield (MYPD) occurs. Figure 1 shows 10-yrs of data from Arlington experiments that tested corn grain and silage response to harvested plant density. In this example, the grain MYPD occurs at about 39K. The economic optimum (EOPD) is about 4K to 5K less than the MYPD. However, you can be within 95% of MY at about 29K indicating how “broad shouldered” the plant density response is (a 10K swing = $37.50/A at $300/80K bag). When the cost of production and ultimate economics are not favorable like this year, you may want to think hard about going after MY, but make sure you are above 29K.

On the silage side it is more difficult to find the EOPD. I have always approached the silage EOPD from the Milk per Acre measure, but that does not take into account seed costs. So in the attached example, Milk per Acre is maximized at 45K. I would think that you need to subtract 4K to 5K to get at the silage EOPD. It will fluctuate widely with milk price and given the outlook for this year you may want to lower the plant density 8K to 10K. Again you are still within 95% of maximum Milk per Acre above 29K.

Figure 1. Relationship between corn plant density and grain yield, economic optimum, forage yield, Milk/Ton, and Milk/Acre. Data are derived from Arlington during 2005 to 2014. (click to enlarge)
Every hybrid and every field likely has different MYPD and EOPD values. Breeders are constantly improving standability of corn hybrids, so the MYPD has been increasing every year by about 400 plants/A. In addition, environment and management style will influence these values (i.e. drought versus a normal year). This relationship indicates the ability of the corn plant to compensate for discrepancies in plant density, but it is highly influenced by grain/silage/milk prices and input costs. It also says a few things about the implications of variable rate seeding.

Wednesday, April 6, 2016

Looking ahead to 2016: The Economics

This spring farmers have been slow to make decisions on a number of inputs. Reluctance has largely been due to weather concerns and economics. The acreage intentions report last week did not help. Corn and soybean prices immediately decreased.

The USDA-ERS has been collecting cost of production (COP) data since 1975. These costs are based on the actual costs incurred by producers. A base survey is conducted every five years. The an annual Agricultural Resource Management Survey (ARMS) has been used to modify the survey base since 1996. These costs of production excludes costs for marketing and storage. ARMS data collection starts during the fall when production practice and cost data are collected, and finishes in the spring when a follow-up interview collects data about whole-farm costs like overhead, interest, and taxes. New data becomes available every May. Each farm sampled in the ARMS represents a known number of farms with similar attributes so that weighting the data for each farm by the number of farms it represents provides a basis for calculating estimates. The country is divided into 9 regions. Wisconsin is part of the Northern Crescent region. Many of the Corn Belt states are in the Heartland region.


Figure 1. Farm resource regions used to summarize cost of production data. (click to enlarge)

Figure 2 shows the cost of production (COP) estimates, profit and COP forecasts for corn in the Northern Crescent and Heartland regions of the U.S. Cost of production has steadily increased over the last decade. Growing an acre of corn costs around $650-$700 per acre on average. For farmers in the Northern Crescent profits have only been seen during 2010 to 2013. Farmers in the Heartland have seen a few more profitable years. Even though yields increase, COP increases as well and average profitability was negative in 2014.

Figure 2. USDA-ERS cost of production (COP) estimates, profit and COP forecasts for corn in the Northern Crescent and Heartland regions of the U.S. (click to enlarge)

Figure 3 itemizes COP for the Northern Crescent and Heartland regions. The categories of seed, fertilizer, equipment and land have increased dramatically since 2005. While the categories of chemicals, labor and overhead have not changed much. Land prices are higher in the Heartland region than the Northern Crescent.

Figure 3. USDA-ERS itemized cost of production (COP) estimates and COP forecasts for corn in the Northern Crescent and Heartland regions of the U.S. (click to enlarge)

The economic challenge of farming during 2016 is more real at this point than other challenges like weather. However, there are still things that can be done to manage for these challenges. Over the next couple of weeks we will discuss some of those options here. Some further reading should include the article "Do We Grow Another Bushel or Save a Buck?"

Tuesday, April 5, 2016

Do farmer acreage intentions predict actual planted acres?

Last Thursday USDA-NASS came out with crop plating intentions for the U.S. This report along with the ending stocks report dramatically influences markets. Last week was no exception with market prices decreasing  with the news that 2016 corn acreage intentions were up 6% and soybean acreage intentions were down 1% from 2015 planted acres. Nationally, ending stocks were up 1% for corn and up 15% for soybean.

The acreage intentions report can influence the crop rotation decision for a field, especially for corn. I was curious as to how well the acreage intentions report reflected actual planted acres, so I collected data back to 1975 for every state that produces corn and compared acreage intentions with planted acres for the year. The results are shown in Figure 1.

Figure 1. Spring Acreage Intentions, Planted Acreage and the Relative difference (%) for Corn and Soybean in the US and WI. (click to enlarge)
With the exception of 1983 and to some extent, 1993 and 1995, acreage intentions have accurately predicted planted acres within 5%. There are as many years over-predicted as under-predicted. For the 40-year period, there was a 3% standard deviation between intended and planted acres for corn and soybeans. In WI, which is typical of northern Corn Belt states, there was wider standard deviation (corn = 5%, while soybean= 11%) indicating weather impacts on acreage decisions as the planting season progresses.

Friday, February 12, 2016

Looking ahead to 2016: The Weather


At nearly every farmer production meeting this winter, speakers have been addressing the unprecedented El Niño event occurring in the Pacific Ocean. Data for El Niño and La Niña events have been collected by the National Oceanic and Atmospheric Administration since 1950 and can be found at https://www.climate.gov/. This El Niño is as strong as other previous events that occurred during 1997-1998, 1982-1983, and 1972-1973 (Figure 1). I heard one climate extension specialist describe this event as the "Godzilla" of El Niño cycles. He further went on to describe the North Pacific Ocean "Blob" where the warmest observed sea surface temperatures are occurring since record keeping began in 1950. Certainly the data is extraordinary.

Figure 1. Cycle of El Niño events as measured by the Oceanic Niño Index (ONI). Data derived from https://www.climate.gov/

I was curious about how El Niño and La Niña events affect Wisconsin corn yield. In Figure 2, I superimposed Wisconsin corn yield data on to the cycle of El Niño events in Figure 1 and added a trendline to the yield data. Since 1950, we have had 6 years when yields were significantly lower than the trendline (1974, 1976, 1988, 1992, 1993, and 2013). Three years, 1974, 1976 and 1988 were "drought" years that were associated with strong La Niña events. However, there are numerous La Niña events where there was no effect on yield and often yields were above the trendline. For the remaining low yielding years, "cool and wet" conditions best described 1992 and 1993, while a "drought" best described 2012; there were no significant El Niño/La Niña events associated with these years.

Figure 2. Cycle of El Niño events as measured by the Oceanic Niño Index (ONI) versus Wisconsin corn yield. Red circles are lower yielding years not related to El Niño/La Niña events. Blue circles are lower yielding years related to strong La Niña events.  Data derived from https://www.climate.gov/ and USDA-NASS.

I then went one step further and plotted U.S. corn grain yields on to the cycle of El Niño events (Figure 3). The red and blue dots in Figure 3 are the years when Wisconsin had significantly lower yield from the Wisconsin trendline as shown in Figure 2. Only two years, 1974 and 1988 were associated with La Niña events. While Wisconsin had poor grain yields in 1976 and 1992, the rest of the country had trendline and record yields. No strong El Niño/La Niña events were associated with lower U.S. corn yields during 1993 and 2012.

Figure 3. Cycle of El Niño events as measured by the Oceanic Niño Index (ONI) versus U.S. corn yield. Red and blue circles are lower yielding years in Wisconsin.  Data derived from https://www.climate.gov/ and USDA-NASS.

I do not see much association of Wisconsin and U.S. corn yields with El Niño/La Niña events (Figures 2 and 3). Some years line up, but many do not. It seems like equal odds for above and below trendline yields. The weather outlook on January 31 is forecasting a drier and warmer summer than normal (source: https://www.climate.gov/).

So from a crop management perspective, how should we plan for 2016? Most agronomic recommendations are based upon multi-location averages. Agronomists collect data and input responses over numerous sites and environments and develop recommendations accordingly. These recommendations are good places to begin as you implement practices in your farm management. Even though the El Niño/La Niña events are unprecedented, I would not change my management style much. Plan for an average year and if the weather is good we can take advantage of it.